This presentation is an HTML5 website
Press → key to advance.
Zoom in/out: Ctrl or Command + +/-
JSXGraph
Dynamic Mathematics running on (nearly) every device
Bianca Valentin, Alfred Wassermann
University of Bayreuth, Germany
- JavaScript library, requires no plug-ins
- Dynamic Mathematics
- interactive geometry
- interactive curve plotting
- turtle graphics
- charts
- Size: 80 kByte
- Free to use. License: LGPL.
- JSXGraph is implemented in JavaScript
- No Java
- No Flash
- PC (Windows, Linux, Mac)
- Mobile phones
- Sony Ericsson K800i (running Opera mini):
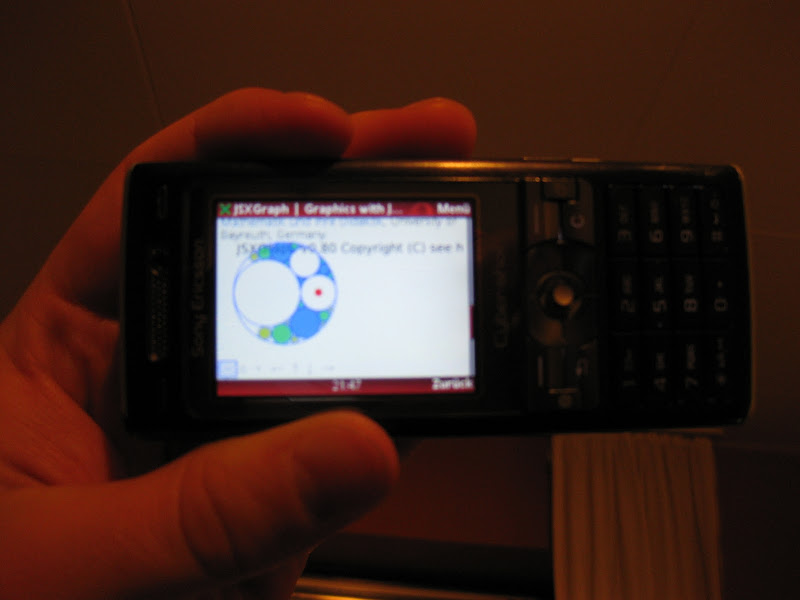
- iPhone
- multi touch tablets (e.g. iPad), see talk by Carsten Miller, Thursday, 9:20.
- Firefox
- Chrome
- Safari
- Internet Explorer (6-8)
- Opera
- DGS implementors: HTML5 compatibility
- Publishers: ebooks
- Teachers, students: JessieScript
- GEONEXT
- Intergeo file format i2geo
- GeoGebra
- Cinderella (alpha quality)
- Arcview (server based)
- moodle
- wordpress
- mediawiki
<jsxgraph width="500" height="500"> var brd = JXG.JSXGraph.initBoard('jxgbox',{boundingbox:[-2,2,2,-2]}); var p = brd.create('point',[1.5,1.5],{face:'o', size:8}); brd.create('segment',[[0,0],p],{dash:3}); </jsxgraph> - drupal
- Bezier curves
- Conic sections
- LATEX syntax for labels and texts
- ASCIIMathML (falls back to Google chart API)
- MathJax (http://www.mathjax.org)
- Animations
- Flexible layer system
var brd, g, w = 30,
x = [], y = [];
brd = JXG.JSXGraph.initBoard('jxgbox1', {axis:true, boundingbox:[0,20,w,-2]});
g = brd.create('curve', [x,y],{strokeWidth:3, strokeColor:'yellow'});

fetchData = function() {
    new Ajax.Request('/ajax/fakesensor.php', {
            onComplete: function(data) {
                var t, a;
                if (200 == data.status) {
                    t = data.responseText;
                    a = parseFloat(t);
                    if (x.length<w) {
                        x.push(x.length);
                    } else {
                        y.splice(0,1);
                    }
                    y.push(a);
                    brd.update();
                };
            }
        });
};
setInterval(fetchData,500);
- Having to program everything with JavaScript to display math with JSXGraph is a hurdle for using it in classroom with students.
- Alternative: JessieScript
- JessieScript is a syntax similar to what is taught in schools and can be parsed by JSXGraph.
- Examples: P(1,1); Q(-2,2); g=[PQ]; k(P,2); M=1/2(P,Q); ||(g,M);
- Easy to learn and use
- Fosters algorithmic thinking
Square = Macro(D,E) {
  k1=k(E,D) nolabel draft; x=[DE] nolabel draft; v=|_(x,E) draft; X=k1&v nolabel;
  z=||(x,X_1) draft; z2=|_(x,D) draft; Y=z2&z nolabel; P[X_1,Y,D,E] nolabel;
}
JSXGraph/GEONEXT Worksheet Creator 2
Take content from- GEONEXT
- i2geo
- GeoGebra
- Cinderella
- JessieScript