Program
Last update 02.10.2025, 5:45 pm
Timezone
All times are in CEST (UTC+2).
Day one, October 7th, 2025
-
15:00: Welcome
-
15:15: Konstantina Zerva: HELM - STACK workbooks: adding interactivity on vector calculus topics
-
15:45: Andreas Maurischat: Exercise pool of the HM4mint consortium

-
16:15: Break
-
16:45: David Flenner: Utilizing Browser Debugging Tools with JSXGraph Applications
-
17:15: Carsten Miller, Alfred Wassermann: Workshop: JSXGraph for beginners , PDF notes
-
18:15: Closing of day 1
Day two, October 8th, 2025
-
14:50: Meet & Greet
-
15:00: Wigand Rathmann: How a Boat Rotates in a River: Visualizing Rotation in Flow Fields
-
15:30: Frauke Sprengel: Interactive Graph Algorithm Learning with JSXGraph and Moodle STACK
-
16:00: Break
-
16:30: Pedro A. García-Sánchez, Mattia Ducci, Lukas Schölch: Audiofunctions+: exploring math functions through sonification , Extended abstract
-
17:00: Alfred Wassermann: Advanced workshop I + discussion, PDF notes I+II
-
17:45: Closing of day 2
Day three, October 9th, 2025
-
14:50: Meet & Greet
-
15:00: Tom Berend: Simplified JSXGraph - JSXGraph with VSCode scaffolding
-
15:30: André Dietrich, Sebastian Zug: JSXGraph & LiaScript … a perfect Match
-
16:15: Break
-
16:45: Sebastian Tabares Amaya: Sr Smith: A Web-Based RF Smith Chart App using JSXGraph and JessieCode
-
17:15: Alfred Wassermann: Advanced workshop II

-
18:00: Closing
Advanced workshop I, II
Alfred Wassermann
University of Bayreuth, Germany
alfred.wassermann@uni-bayreuth.de
Abstract
In two workshops we will cover more advanced topics of JSXGraph programming. The topics will mostly be oriented on changes that happened in JSXGraph since the conference in 2024, that is since version v1.10.0. The plan so far is to cover:
- Progress in 3D
- 3D polyhedra
- ARIA
- Extension programming
Workshop: JSXGraph for beginners
Carsten Miller, Alfred Wassermann
University of Bayreuth, Germany
carsten.miller@uni-bayreuth.de , alfred.wassermann@uni-bayreuth.de
Abstract
This workshop will cover the basics of working with JSXGraph. The nice thing about the JSXGraph is that you do not need to be a programmer to use it. In the workshop, we will talk about the tools and how to prepare the working environment. By constructing the examples, we will cover some basic objects as points, lines, circles, intersections, and angles.
HELM - STACK workbooks: adding interactivity on vector calculus topics
Konstantina Zerva
The University of Edinburgh, UK
Abstract
HELM (Helping Engineers Learn Mathematics) is a collection of 50 workbooks developed by five English universities between 2002 and 2005. HELM resources cover the basic engineering mathematics and statistics teaching for first and second year mathematics courses for engineering undergraduates.
During the summers of 2020 and 2021, the universities of Edinburgh and Loughborough undertook an effort of embedding the HELM materials into STACK. The result was a collection of quizzes, each serving as interactive workbooks complete with textbook-style content, detailed worked examples, tasks of varying complexity, and practice questions. Almost 2/3 of the HELM workbooks have been embedded into STACK, mainly the ones covering the first-year engineering teaching. In the previous year, I was awarded funding through the Principal’s Teaching Award Scheme at the university of Edinburgh, to continue the translation of HELM into STACK. The project was carried out during the summer of 2025 by two undergraduate interns, who mainly worked on 3 workbooks related to vector calculus.
How a Boat Rotates in a River: Visualizing Rotation in Flow Fields
Wigand Rathmann
Friedrich-Alexander-Universität Erlangen-Nürnberg (FAU), Department Mathematik, Erlangen, Germany, and
Center of Mobile Learning with Digital Technology, University of Bayreuth, Bayreuth, Germany
Abstract
We all know rivers and can imagine, to sit a boat enjoying sun and clouds at the sky and we are drifting along a river not using any paddel.
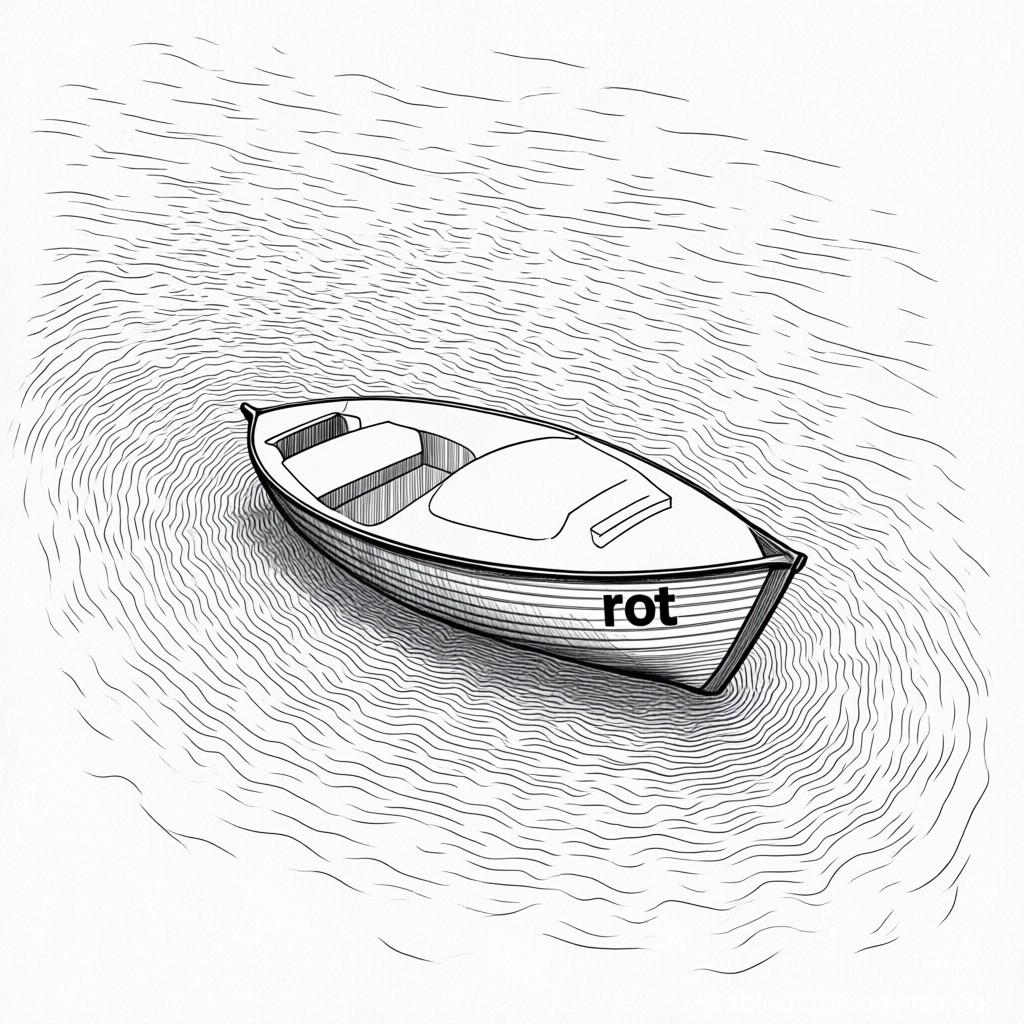
Generated using Stable Diffusion
Sounds like vacation and the rotation of the boat brings as the \(\operatorname{curl}\)-Operator. Thus we wake up back having vector fields in mind thinking about a boat became a single point and moving as a particle through the vector field along a curve \(k\) with an angle velocity induced by the fluid.
Exercise Pool of the HM4mint consortium
Andreas Maurischat
RWTH Aachen University, Aachen, Germany
maurischat@combi.rwth-aachen.de
Abstract
Besides the online course hm4mint.nrw , the consortium HM4mint has initiated a pool for electronic exercises including several graphical exercises.
In this talk, we present examples of such exercises, we explain how you can import these exercises into your local LMS, and how you can adapt the exercises to your individual style.
Audiofunctions+: exploring math functions through sonification
Pedro A. García-Sánchez, joint work with Mattia Ducci, Ondřej Nečas, and Lukas Schölch
Departamento de Álgebra and IMAG, University of Granada, E-18071, Spain
Abstract
In this talk we will present Audiofunctions+, which is a web app designed to facilitate visually impaired students’ learning of mathematical functions. Audiofunctions+ allows users to interpret the shape of a function’s graph by listening to its sonification.
The talk is suitable for both high school and university educators.
Interactive Graph Algorithm Learning with JSXGraph and Moodle STACK
Frauke Sprengel
Department of Computer Science, Faculty IV - Business and Computer Science, Hannover University of Applied Sciences and Arts, Hannover, Germany
frauke.sprengel@hs-hannover.de
Abstract
Teaching fundamental graph algorithms such as Kruskal’s minimum spanning tree, Dijkstra’s shortest path, and depth-first/breadth-first search often relies on static materials that do not adequately convey the interactive nature of algorithmic decision-making. This presentation describes a framework for creating interactive graph algorithm exercises using JSXGraph integrated with Moodle’s STACK question type system.
JSXGraph & LiaScript ... a perfect Match
JSXGraph & LiaScript … a perfect Match
name: Dr.-Ing. André Dietrich & Prof. Dr.-Ing. Sebastian Zug
adress:
TU Bergakademie Freiberg
Bernhard-von-Cotta-Straße 2
09599 Freiberg
abstract:
Liascript is an extension for markdown with was especially developed as a language easy and dezentralized creation of interactive online courses, in short a language for OER. It add various features to markdown, which where previously missing, such as the integration of multimedia content, integration of Oembed sites, the execution of script-tags, animations in combination text to speech output to generate a mixture between screencast and interactive textbooks. It does not require an additonal compilation step, since the content is directly interpreted within the browser. Additonally other markdown-dialects often lack of extending the language, in LiaScript this is possible with an additional macro-syntax which allows for integrating an mixing external javascript, css, plus the liascript markdown language.
Utilizing Browser Debugging Tools with JSXGraph Applications
David Flenner
College of Charleston Department of Mathematics 66 George St Charleston SC 29424
Abstract
Bug-free code is something we all strive for, but there are bound to be unexpected situations that we don’t account for when developing a JSXGraph app for the first time. This talk will be a continuation of my presentation from the JSXGraph conference last year, which focused on best practices when first getting started with creating applications using JSXGraph. This year, I will focus on how to utilize tools within your browser to debug problems that exist in your code, as it is inevitable that bugs will exist. Knowing how to best utilize the available tools provided in your browser can help you find these bugs and eliminate them. I will demonstrate the creation of a basic app that has a bug and show how these browser tools can help identify where the bug exists and correct the code. The intended audience is mathematics instructors at all levels who are interested in app development for their classes, but it can be useful for any developer who is unfamiliar with these tools.
Sr Smith: A Web-Based RF Smith Chart App using JSXGraph and JessieCode
Sebastian Tabares Amaya
2 Tian Jin Li Gong Da Xue Qing Nian Jiao Shi He Xue Zhe Gong Yu, Xi Qing Qu, Tian Jin Shi, China, 300387
Abstract
Sr Smith is a powerful web application that reinvents the classic Smith Chart for the digital age. Built with the high-performance JSXGraph library and the intuitive JessieCode DSL, it provides RF engineers, professors and students with an interactive platform for circuit analysis and design, with a graphical experience similar to GeoGebra.